Every site and machine, HQ to floor
Every site, machine and operator on one platform, from HQ dashboards down to the iPad on the floor.
150+ sites, and HQ could not see one of them
Site performance arrived by spreadsheet, emailed weekly. HQ could not compare locations, spot an underperforming machine, or make a floor-layout decision on anything better than gut feel. On the ground, operators had clipboards.
Reporting by email. Every site compiled its own spreadsheet and sent it weekly. By the time the numbers were stitched together at HQ, they were days old and impossible to compare like for like.
Machines nobody measured. No view of which machines earned their floor space and which were dead weight. Layout decisions - what sits where, what gets moved, what gets retired - ran on opinion.
Clipboards on the floor. The people closest to the machines had no tools at all. Manual counts, paper readings, and a long trip from the arcade floor to a spreadsheet cell.
Weekly reporting took days to compile and landed too late to act on. Underperformance ran for weeks before anyone saw it.
No revenue-per-square-metre view existed. The floor - the business's core asset - had no measurable return.
Different spreadsheets, different formats, different weeks. Comparing one location against another was manual work, so it rarely happened.
One platform, five tiers of user, 150+ sites
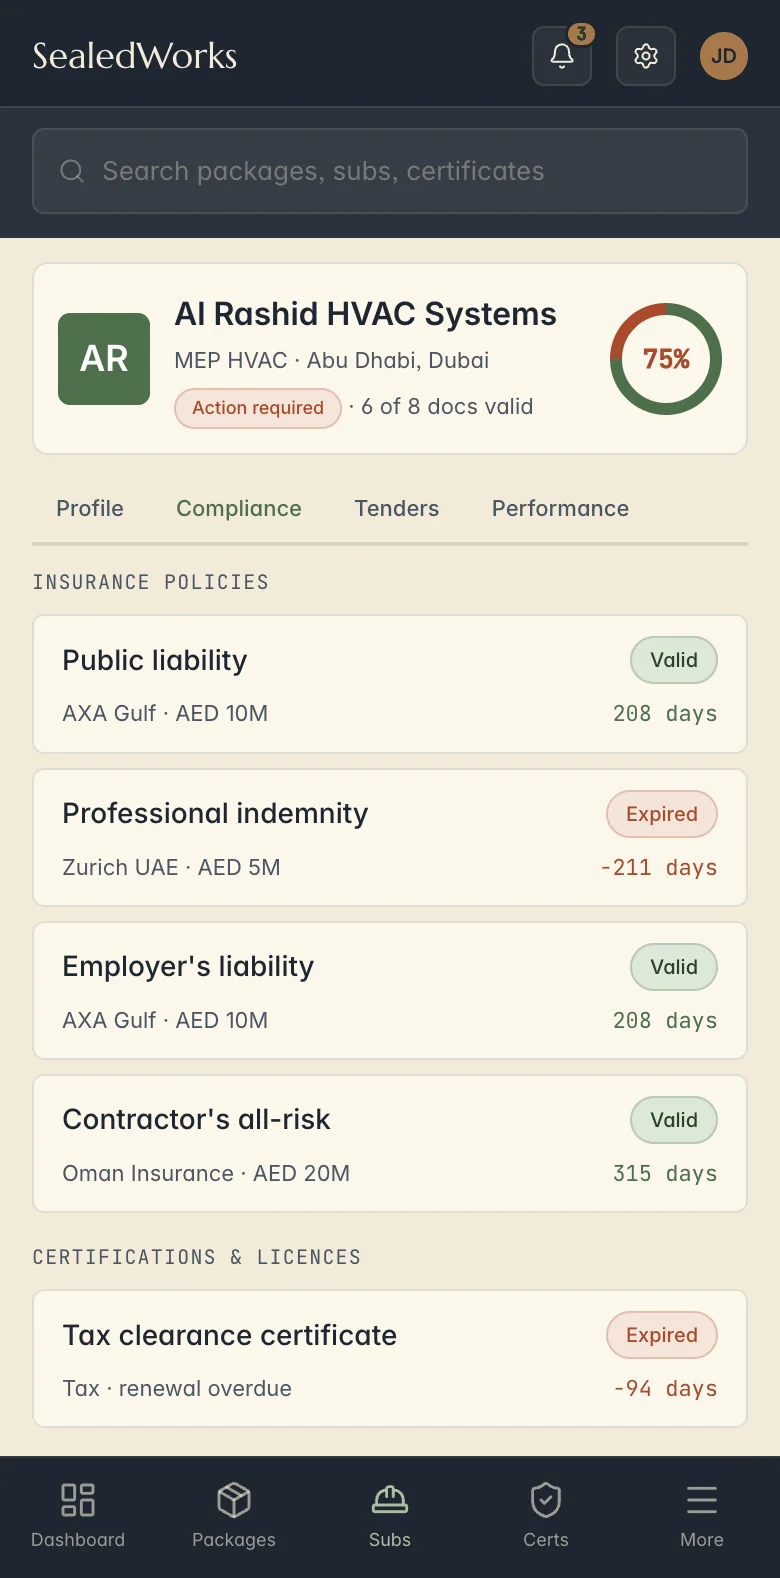
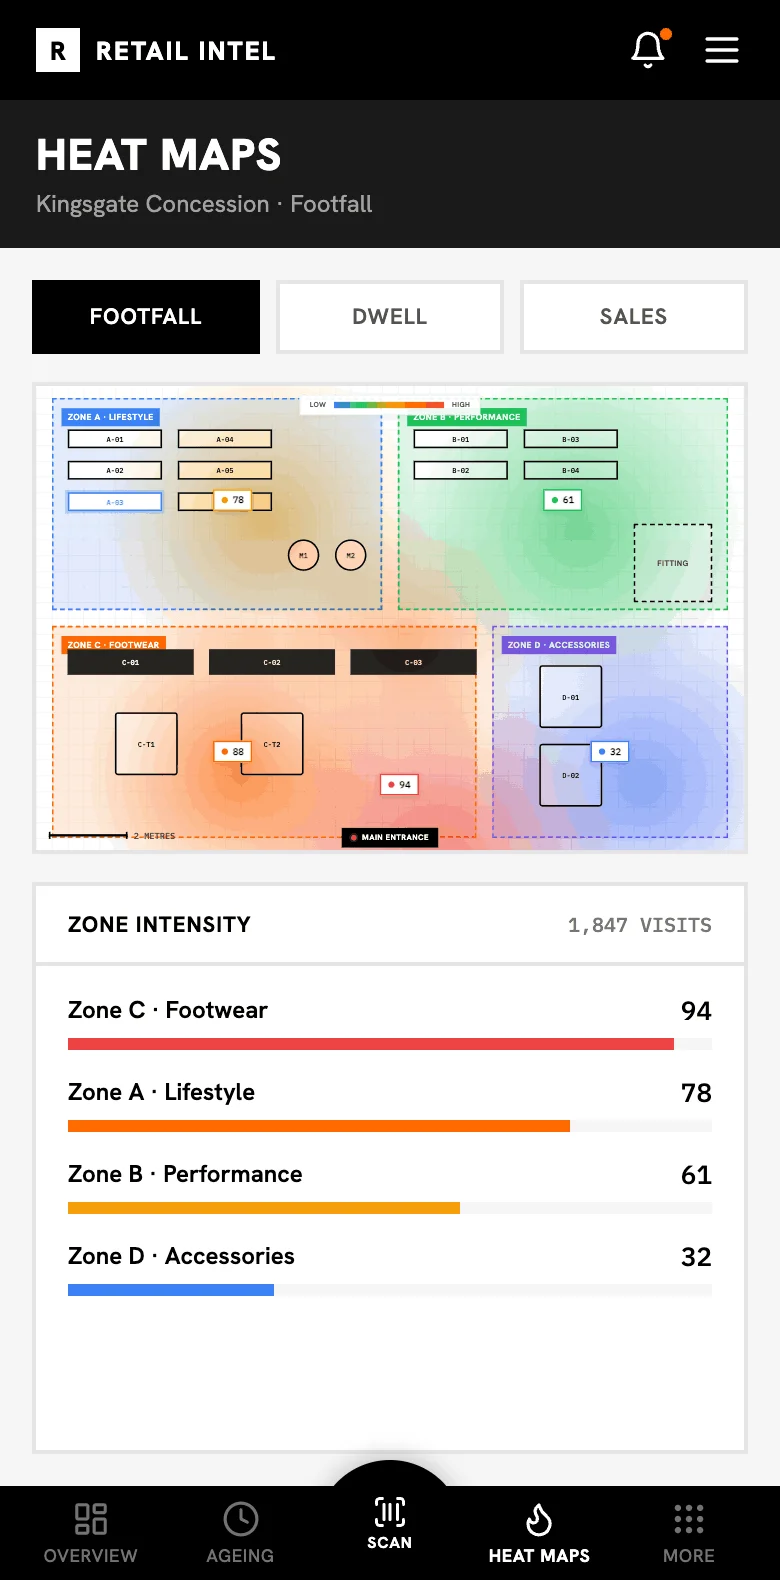
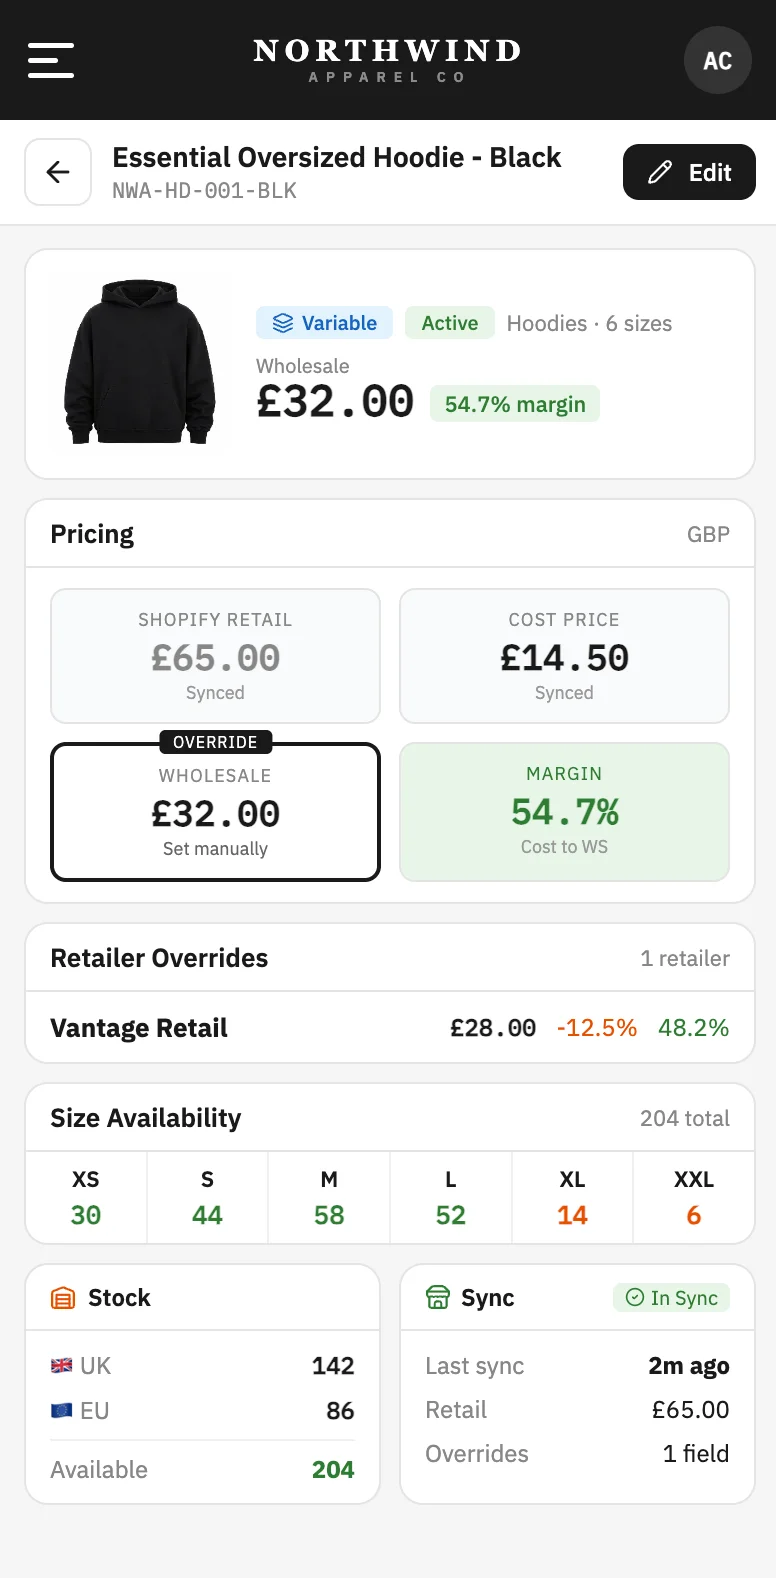
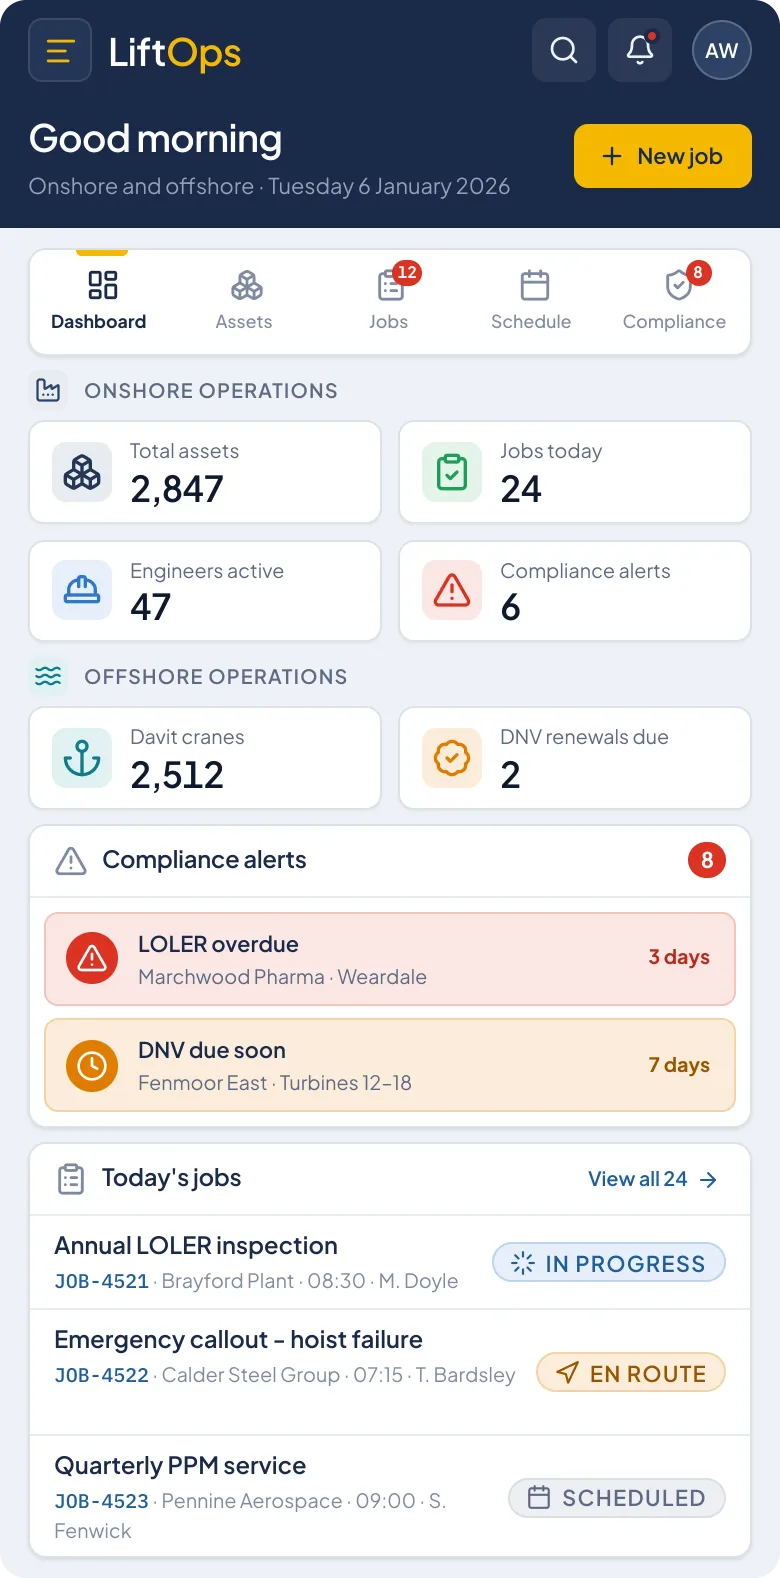
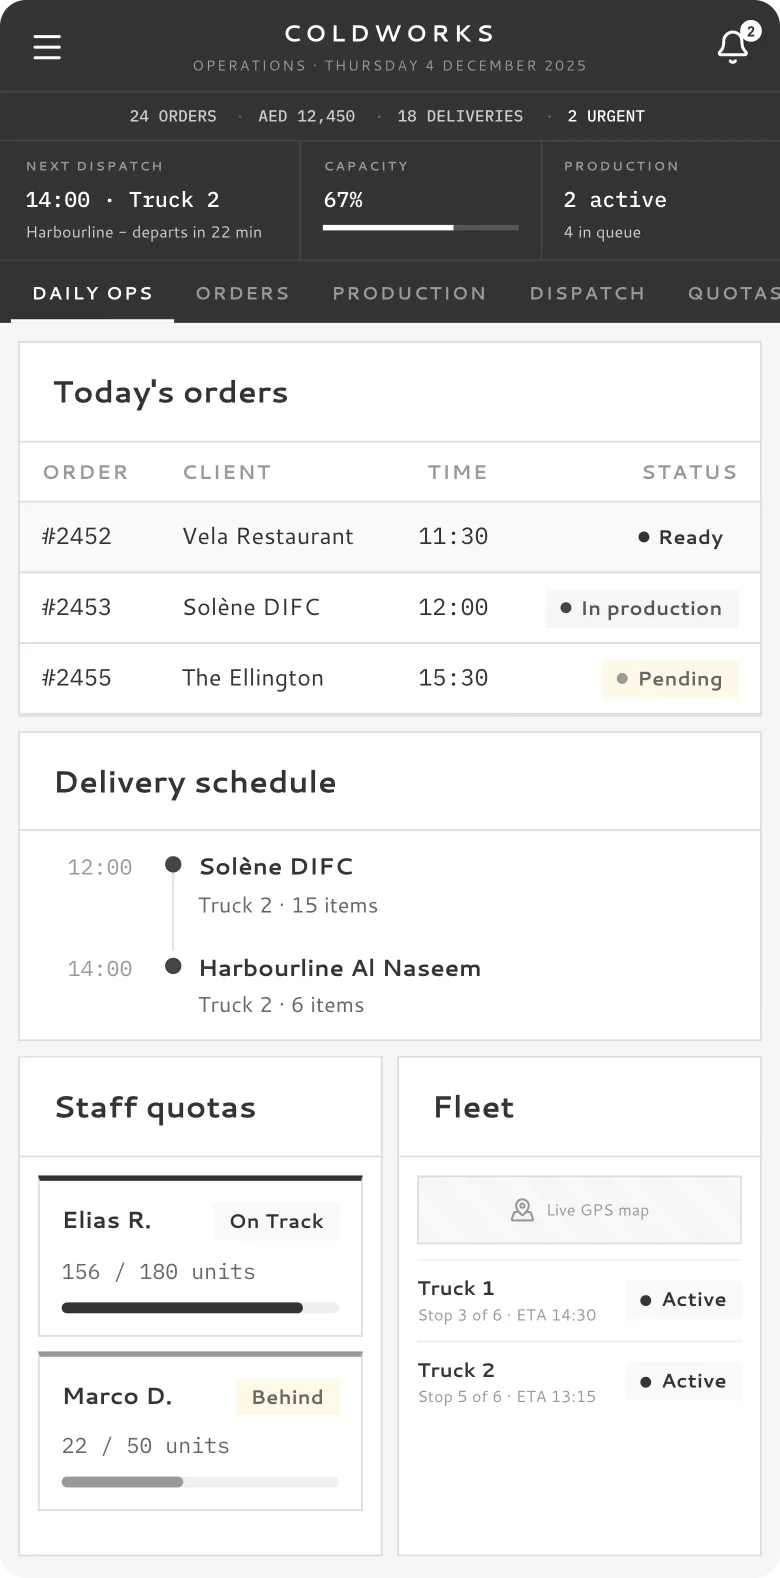
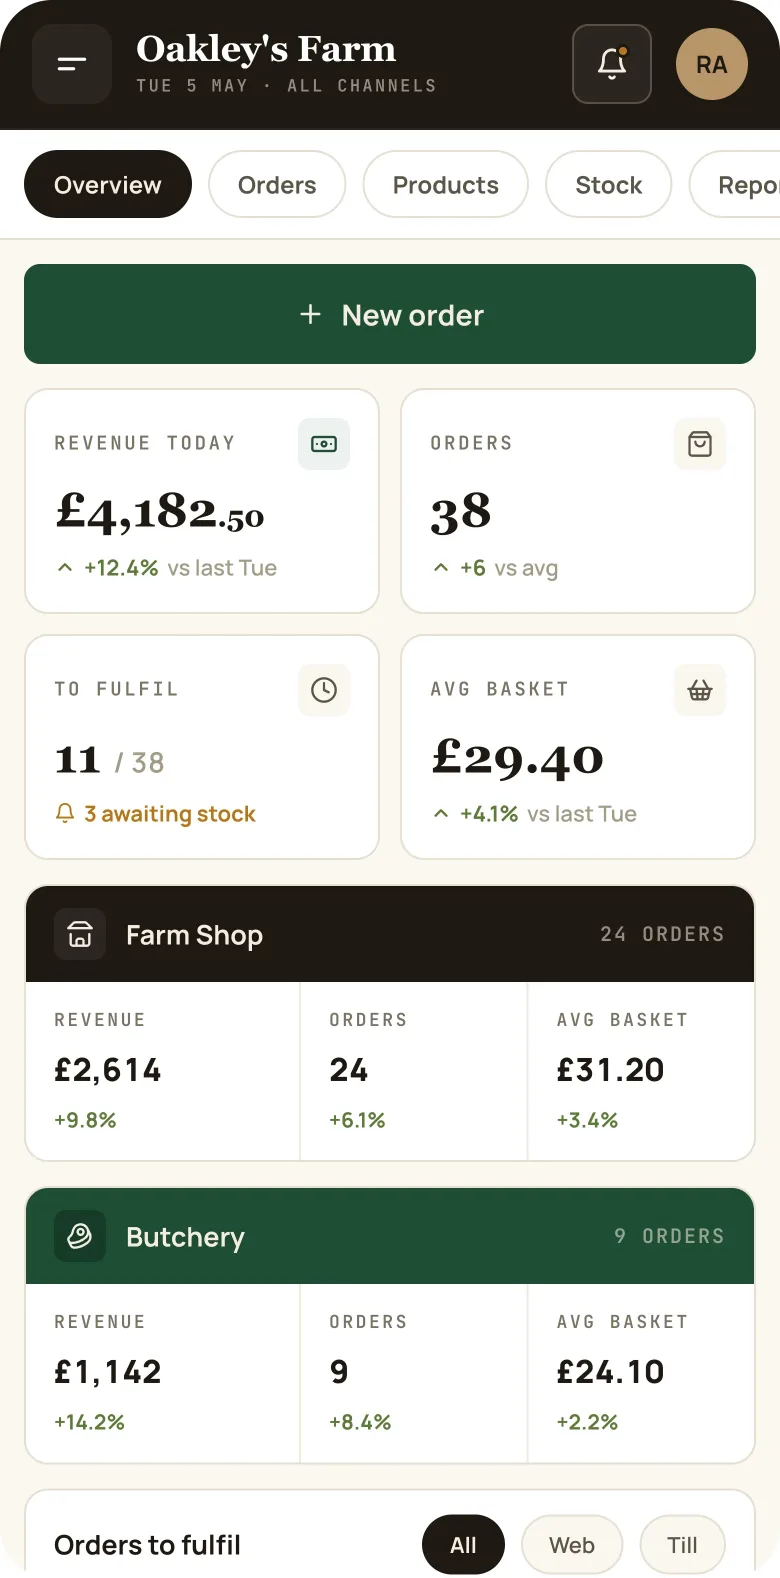
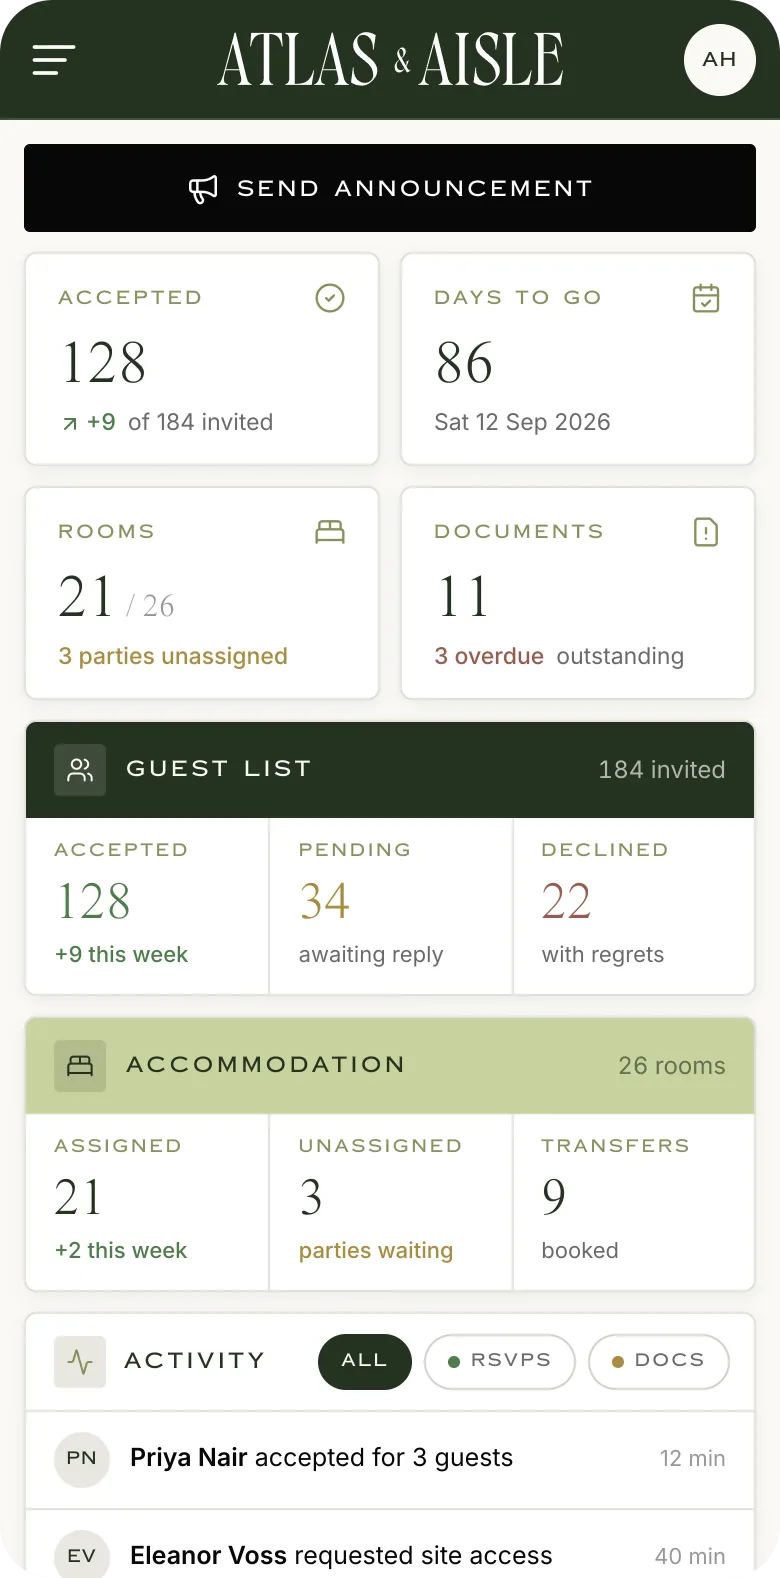
Seven screens from the platform, each shown as it runs on the device you are reading this on. The first three are HQ command; the last four are the floor.
A dark console frame around bright, glanceable data
The navy console chrome recedes so the white data surfaces come forward. Brand green carries the actions; four signal colours carry the state of 150+ sites, from HQ command down to the operator's iPad.


The calls we made

Corporate HQ, regional managers, site managers, supervisors and floor operators all work from the same data through a different lens. The hierarchy is built into the platform, not bolted on - what you see is what your role needs, nothing more.
Every floor is drawn digitally with drag-and-drop fixtures, then heat maps lay revenue per square metre over the top. The floor stops being a diagram and becomes an asset with a measurable return.
Move a machine, run the test, read the result. A/B position testing with statistical validation turned layout meetings into experiments with answers.
The people closest to the machines got tools first. Floor staff capture readings and counts on an iPad at the machine, and the reporting that used to take days now assembles itself.
Built by a senior team end to end and handed over with the client owning the platform outright.

A business HQ can finally see
Every site, machine and operator on a single platform. Executives watch performance across 25+ countries in real time, floors are tested rather than argued about, and the weekly reporting that took days now happens on its own.
Every location managed through one platform, from executive dashboards at HQ down to the iPad in an operator's hands on the arcade floor.
Floor layouts are now tested, not argued about.
Handled to the standard the work demands
150+ sites in 25+ countries on one platform, with a five-tier permission hierarchy so every user sees exactly their slice of the operation and nothing beyond it.
The operator interface is built for the arcade floor as it is - fast capture at the machine, on an iPad, usable without training.
Built senior-only and handed over with the client owning the platform outright. Client names available under NDA.